Combinatorics in Matplotlib
Happy Wednesday everybody! This past week, I held a seminar on Logic as part of our series on “The Computer Science You Never Took in College”. We covered many topics around logic- including binary logic and operations, set operations, propositional logic, and combinatorics!
Today I would like to discuss the latter topic while also breaking down a fun matplotlib-based example I used to highlight the different combinatoric functions we have available to us in Pythons standard library itertools.
from matplotlib.pyplot import rc

rc('font', size=18)
rc('figure', facecolor='white')
Combinations
Combinations are unique sets of sampling outcomes. This is akin to drawing tiles from a bag, or selecting individuals from a population. For the following example, pretend we have a bag of Scrabble tiles with letters A-Z. When playing Scrabble, we do not care about the order of tile selection, nor we replace tiles once they have been drawn. These two features are what makes up a combination.
Standard combinations are unordered and do not exhibit replacement between draws.
from itertools import combinations

from matplotlib.pyplot import subplots, show
from matplotlib.ticker import FixedLocator, FixedFormatter

def combinatoric_ax(ax, func, population, r=2):
    # Set the ylimits/ticks to be 0-len(population)
    y_min, y_max = 0, len(population)
    ax.set_ylim(y_min-.1, y_max - 1 + .1)
    ax.yaxis.set_tick_params(length=0, labelleft=True, labelright=True)

    # Ensure labels are representative of the sample
    ax.yaxis.set_major_locator(FixedLocator(range(y_min, y_max)))
    ax.yaxis.set_major_formatter(FixedFormatter(population))

    # x-axis represents the number of draws we’re performing
    ax.set_xlim(-.1, r-1+.1)
    ax.xaxis.set_tick_params(length=10, width=5, labelsize=0)
    ax.xaxis.set_major_locator(FixedLocator(range(r)))
    ax.set_xlabel('Nth Draw')

    ax.spines[['left', 'top', 'right', 'bottom']].set_visible(False)
    ax.set_title(func.__name__.replace('_', ' '), va='bottom', y=1.05)

    text_kwargs = dict(x=.57, y=.98, va='bottom', transform=ax.transAxes)
    ax.text(s='Count:', ha='right', **text_kwargs)
    ax.text(s=0, ha='left', label='total', **text_kwargs)

    return ax

fig, ax = subplots(figsize=(8,6))
population = [*'ABCD']
r = 2

ax = combinatoric_ax(ax, func=combinations, population=population, r=r)
for i, combo in enumerate(combinations(population, r=r), start=1):
    ax.plot(combo)

total, = ax.findobj(lambda artist: artist.get_label() == 'total')
total.set_text(i)
show()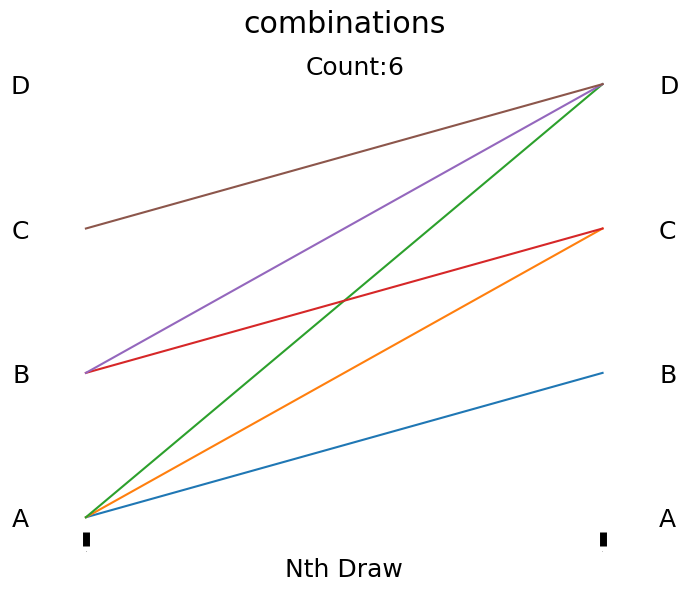
Examining the plot above, we see that each line represents a sampling from our population of 'tiles' A, B, C, and D. Since order does not matter all of our lines move in the same diagonal direction. Selecting A, then B is no different than selecting B, then A. Furthermore it is impossible to draw A, then A because we are not replacing the tiles and only have 1 of each tile to begin with.
Combinations With Replacement
If we are interested in combinations (where the order of selection does not matter) but we want to use replacement, then we can use the aptly named combinations_with_replacement from Python's itertools module. This has the same interface as the previous function, except we now have the ability to select A twice from our population since we put each tile back after each selection.
from itertools import combinations_with_replacement

fig, ax = subplots(figsize=(8,6))
population = [*'ABCD']
r = 2

ax = combinatoric_ax(ax, func=combinations_with_replacement, population=population, r=r)
for i, combo in enumerate(combinations_with_replacement(population, r=r), start=1):
    ax.plot(combo)

total, = ax.findobj(lambda artist: artist.get_label() == 'total')
total.set_text(i)
show()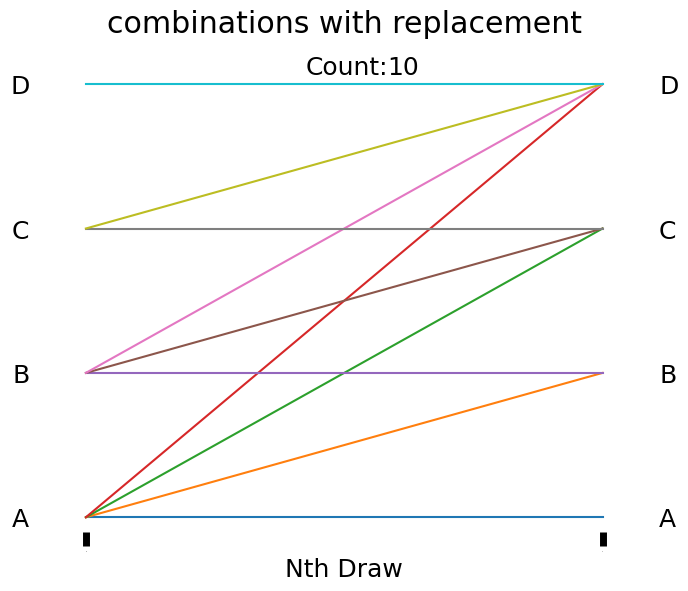
Looking at the graphic above, we can see that we have the exact same graphic as the one generated from the combinations function, except that we now also have horizontal lines. These horizontal lines are representative of the cases when we draw the same tile twice due to replacement.
Using combinations with replacement is a very handy sampling approach that is used in statistics to boost statistical power when dealing with small sample sizes. This approach is called bootstrapping, and boils down to the notion that when sampling for statistics, we may not want to make a large assumption of the shape of the population distribution. We can use this sampling approach explore a data-driven estimate of a given population statistic.
Permutations
A permutations is a combinatoric function where orderedness of the results matters, but replacement does not occur. Abandoning our Scrabble example, a permutation can be represented by the thought experiment of trying to organize students in a classroom. If you have N students in the school, how many different ways can you organize any 20 of them into your classroom. An added constraint is that the order of the students matters- a classroom full of students where a given student is in the back of the classroom is different than a classroom full of students where that same student is seated in the front of the classroom.
from itertools import permutations

fig, ax = subplots(figsize=(8,6))
population = [*'ABCD']
r = 2

ax = combinatoric_ax(ax, func=permutations, population=population, r=r)
for i, combo in enumerate(permutations(population, r=r), start=1):
    ax.plot(combo)

total, = ax.findobj(lambda artist: artist.get_label() == 'total')
total.set_text(i)
show()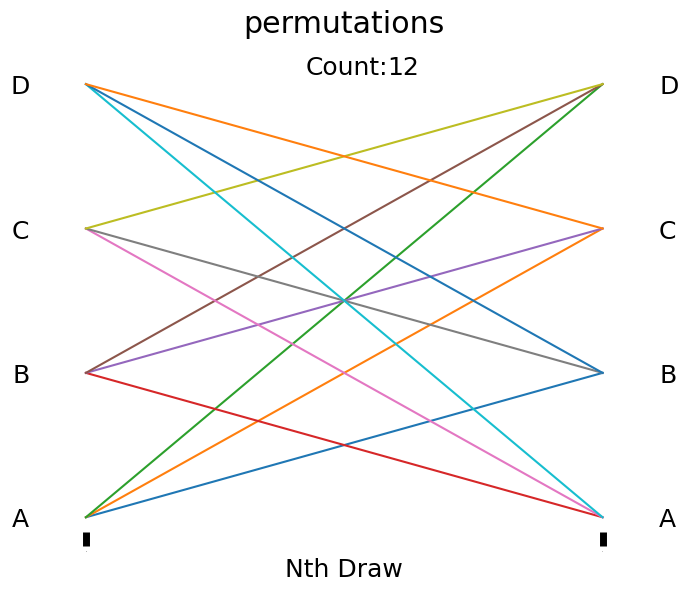
We can tell the graphic above represents permutations because we observe lines in both diagonal directions (indicating that A → B is different than B → A, and we capture both results). Additionally, the lack of horizontal lines in this plot (represented by horizontal lines) is the second piece of evidence that points us toward a representation of permutations.
Product
The product of a group is a form of sampling where both orderedness matters, and replacement occurs between draws. This form of sampling can be thought of as a way to represent the possible inputs for the combination of a safe. In this case, if I have a safe with 4 numbers and need to input 2 values to unlock it, you can see below that there are 16 different possible inputs that will unlock this safe.
When entering a combination into a safe, a combination of 0→1 is different than 1→0, and combinations that contain repeats are possible since one does not remove an input number from a safe once they have entered that value.
from itertools import product

fig, ax = subplots(figsize=(8,6))
population = [*'ABCD']
r = 2

ax = combinatoric_ax(ax, func=product, population=population, r=r)
for i, combo in enumerate(product(population, repeat=r), start=1):
    ax.plot(combo)

total, = ax.findobj(lambda artist: artist.get_label() == 'total')
total.set_text(i)
show()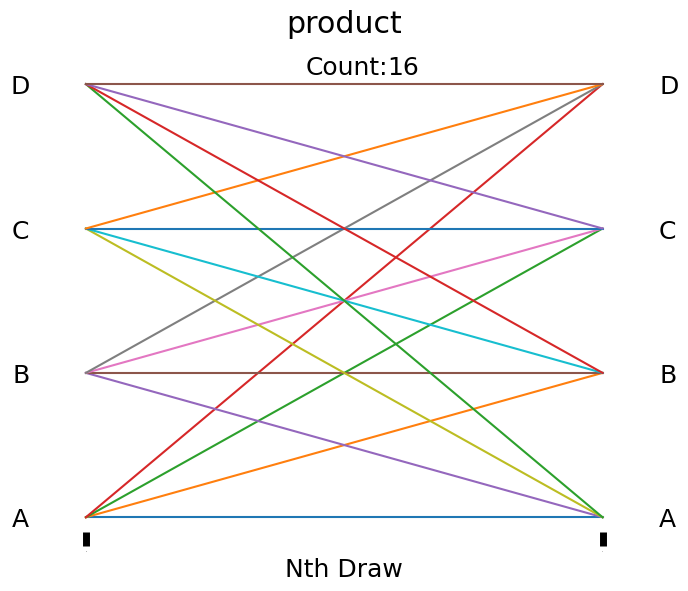
In the graphic above, we see diagonal lines in both directions AND horizontal lines, indicating that both orderedness of drawn samples matter and that replacement occurs between draws.
Cartesian Product
One final use of a product does not have to do with sampling, and instead deals with pairing of 2 or more groups of objects with eachother. The whole point of the cartesian product is to generate all combinations of elements across multiple groups. This is also implemented in itertools.product and can be achieved by specifying multiple positional arguments.
from itertools import product

for combo in product(['A', 'B', 'C', 'D'], ['X', 'Y', 'Z']):
    print(combo)

# ('A', 'X')
# ('A', 'Y')
# ('A', 'Z')
# ('B', 'X')
# ('B', 'Y')
# ('B', 'Z')
# ('C', 'X')
# ('C', 'Y')
# ('C', 'Z')
# ('D', 'X')
# ('D', 'Y')
# ('D', 'Z')
('A', 'X')
('A', 'Y')
('A', 'Z')
('B', 'X')
('B', 'Y')
('B', 'Z')
('C', 'X')
('C', 'Y')
('C', 'Z')
('D', 'X')
('D', 'Y')
('D', 'Z')You may be wondering how this idea is useful in programming- well this is a fantastic approach to flatten any level of nested for-loop. This will save you horizontal space in your code and can be used to simplify some of your logic when operating with nested loops.
Additionally, this principle is how a cross join works when working with tabular data. This is useful for generating tables of all rows from one table against another.
from itertools import (
    combinations, combinations_with_replacement,
    permutations, product
)
from matplotlib.pyplot import subplot_mosaic
from matplotlib.lines import Line2D

mosaic = [
    [combinations, combinations_with_replacement],
    [permutations, product]
]
fig, axd = subplot_mosaic(mosaic, figsize=(12,8), gridspec_kw={'hspace': .3})
population = [*'ABCD']
r = 2

for c_func, ax in axd.items():
    ax = combinatoric_ax(ax, func=c_func, population=population, r=r)
    c_iterator = c_func(population, repeat=r) if c_func is product else c_func(population, r=r)
    for i, combo in enumerate(c_iterator, start=1):
        ax.plot(combo)

    total, = ax.findobj(lambda artist: artist.get_label() == 'total')
    total.set_text(i)
    if c_func is combinations or c_func is combinations_with_replacement:
        ax.set_xlabel(None)

# Adds subplot separation lines
fig.add_artist(Line2D([.1, .93], [.48, .48], color='k'))
fig.add_artist(Line2D([.515, .515], [.1, .8], color='k'))
fig.suptitle('Combinatorics in Matplotlib')
fig.text(.5, .94, s=f'{population = }; {r = }', va='top', ha='center')
fig.subplots_adjust(top=.8)

show()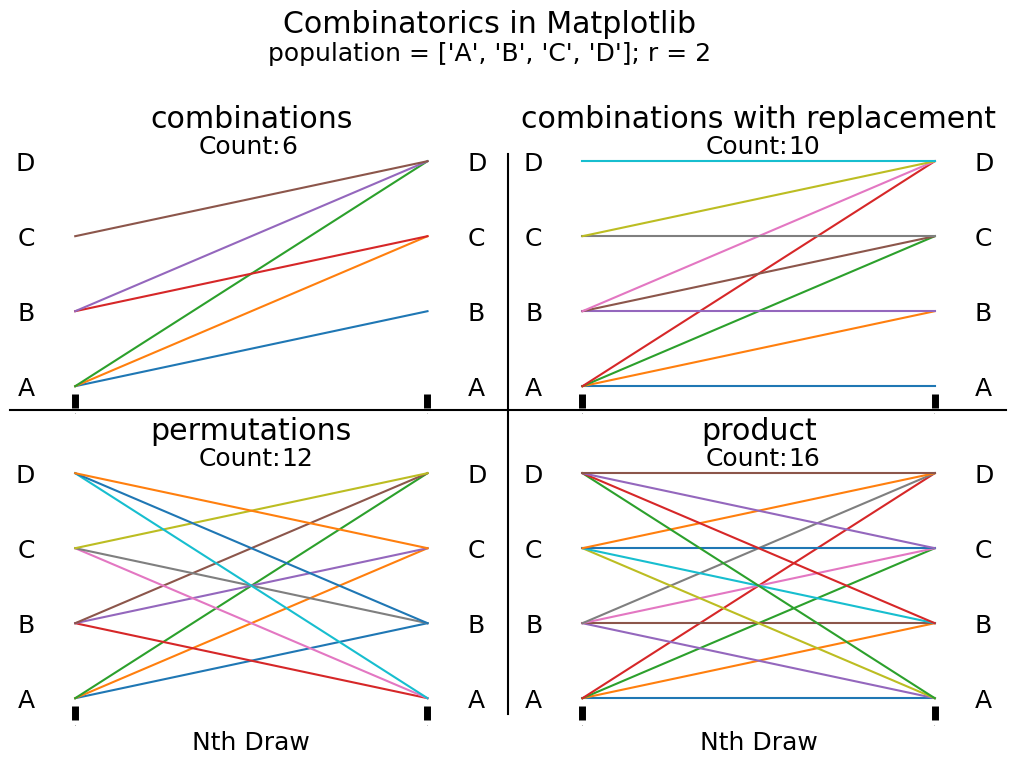
Wrap Up
That just about covers all of the combinatorics that Python has available as part of the built-in itertools module! Next time you're selecting samples from a population, I hope you reach for it and consider the constraints of orderedness and replacement that you are operating under. Talk to you all next week!