Matplotlib Legends: Artists & Handlers
Hey all, got some matplotlib for you this week. I wanted to start touching on some more advanced ideas about it and decided to demonstrate a question I answered on Stack Overflow not long ago.
The question asked about custom legend artists- essentially asking “How can I change the style of the artists matplotlib presents in a given legend.” While the longest way to do this is to construct a Legend manually, thankfully matplotlib provides an escape hatch in the form of the handler_map argument.
What is a Legend Handler?
A legend handler is an object that handles the drawing of a proxy Artist (an Artist that is similar to the one drawn on the Axes) onto a Legend. To do this, it simply applies some transformations and performs drawing on a Legend object instead of on an Axes.
Before I go too far into a Legend Handler, we should visit the handler_map argument of a Legend. The handler_map is a dictionary that provides mappings of Artists → Handlers, meaning when a Legend encounters a specific Artist (Line2D (commonly lines on a line plot), Patch (commonly bars from a barplot), PathCollection (commonly scatter plot markers)), then it will use the corresponding Handler to draw that Artist on the Legend.
matplotlib has default pairings, which is why the Legend works quite well without needing to supply the handle_map. You can also view these by calling the classmethod Legend.get_default_handler_map().
from pprint import pprint
from matplotlib.legend import Legend

pprint(
    Legend.get_default_handler_map()
)
{<class 'matplotlib.patches.Patch'>: <matplotlib.legend_handler.HandlerPatch object at 0x741cf14f6fc0>,
<class 'matplotlib.lines.Line2D'>: <matplotlib.legend_handler.HandlerLine2D object at 0x741cf14f6f00>,
<class 'matplotlib.patches.StepPatch'>: <matplotlib.legend_handler.HandlerStepPatch object at 0x741cf14f7050>,
<class 'matplotlib.collections.LineCollection'>: <matplotlib.legend_handler.HandlerLineCollection object at 0x741cf180e420>,
<class 'matplotlib.collections.CircleCollection'>: <matplotlib.legend_handler.HandlerCircleCollection object at 0x741cf14f7380>,
<class 'matplotlib.collections.PathCollection'>: <matplotlib.legend_handler.HandlerPathCollection object at 0x741cf14f7590>,
<class 'matplotlib.collections.PolyCollection'>: <matplotlib.legend_handler.HandlerPolyCollection object at 0x741cf160e750>,
<class 'matplotlib.collections.RegularPolyCollection'>: <matplotlib.legend_handler.HandlerRegularPolyCollection object at 0x741cf14f7110>,
<class 'matplotlib.container.BarContainer'>: <matplotlib.legend_handler.HandlerPatch object at 0x741cf14f73e0>,
<class 'matplotlib.container.ErrorbarContainer'>: <matplotlib.legend_handler.HandlerErrorbar object at 0x741cf14f6e70>,
<class 'matplotlib.container.StemContainer'>: <matplotlib.legend_handler.HandlerStem object at 0x741cf14f66c0>,
<class 'tuple'>: <matplotlib.legend_handler.HandlerTuple object at 0x741cf14f7470>}When to use a custom Handler?
There are various times you'll want to use your own Handler. However usecases will typically fall into one of two categories:
The default handler matplotlib provides doesn't look how I want it to, and the exposed .legend arguments don't provide enough control to fix it.
matplotlib does not have an entry for the type of Artist I want in my legend.
In regards to the former, I should also mention that matplotlib provides various subclasses of HandlerBase objects to provide some explicit control over the drawing of legend handles. However, I don't find these nearly as useful as a fully customized Handler. It's a little more boilerplate, but you gain full control over how each Artist is drawn on your legend.
In the question I answered on Stack Overflow, the question focused on the former of the two cases I laid out above. An individual was drawing Wedges on their plot, and wanted the Legend to also have a Wedge in the same shape as the original Artist.
Unfortunately the Wedge inherits from matplotlib.patches.Patch which is mapped to a generic Patch (rectangle) Handler
from matplotlib.patches import Wedge

handler_map = Legend.get_default_handler_map()
artist = Wedge((0, 0), 0, 0, 0)
print(
    Legend.get_legend_handler(handler_map, artist)
)
<matplotlib.legend_handler.HandlerPatch object at 0x741cf14f6fc0>The Default HandlerPatch
As I mentioned before, the HandlerPatch only draws rectangles. So if we draw a Wedge onto an Axes and attempt to create a legend, we should expect to see the proxy Artist to be a simple rectangle with the same aesthetic features as the Wedge
from matplotlib.pyplot import subplots, show
from matplotlib.patches import Wedge
from matplotlib import rc

rc('font', size=18)

colors = ['#e41a1c','#377eb8','#4daf4a','#984ea3']
theta2 = [90, 180, 270, 360]
r = .25
fig, ax = subplots(figsize=(4, 4))
# Axes has no ax.wedge method
artist = Wedge((.5, .5), r=.25, theta1=0, theta2=270, label='My Wedge')
ax.add_artist(artist)
ax.legend()
ax.tick_params(
    which='both', labelbottom=False, labelleft=False,
    bottom=False, left=False
)

show()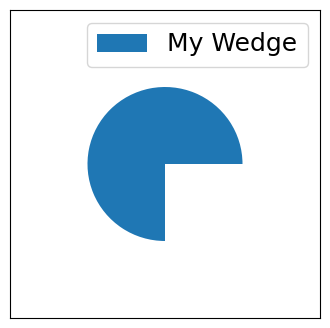
So how do we create an entry in our legend that looks just like the artist drawn on our Axes? Well, we create a Handler class that has a legend_artist method, and do the drawing there! I'll avoid boring you with too many details, as they can already be found in the matplotlib documentation. Let's take a look at how to implement this on our own!
A Custom WedgeHandler
There’s not much else to say as far as implementing the handler. I commented the code to help readers parse through it.
from matplotlib.pyplot import subplots, show
from matplotlib.patches import Wedge
from matplotlib import cm
from matplotlib import rc

class WedgeHandler:
    def legend_artist(self, legend, orig_handle, fontsize, handlebox):
        x0, y0 = handlebox.xdescent, handlebox.ydescent
        width, height = handlebox.width, handlebox.height
        r = min(width, height)

        handle = Wedge(
            center=(x0 + width / 2, y0 + height / 2),      # centers handle in handlebox
            r=r,                                           # ensures radius fits in handlebox
            width=r * (orig_handle.width / orig_handle.r), # preserves original radius/width ratio
            theta1=orig_handle.theta1,                     # copies the following parameters
            theta2=orig_handle.theta2,
            color=orig_handle.get_facecolor(),
            transform=handlebox.get_transform(),           # use handlebox coordinate system
        )

        # Add this new Artist to the handlebox
        #   the handlebox is the drawing area for a given
        #   entry in the legend
        handlebox.add_artist(handle)
        return handle

rc('font', size=18)

# need to manually supply colors as add_artist
#    does not advance the Axes.prop_cycle
theta2 = [90, 180, 270, 360]
colors = cm.tab10.colors
r = .25

fig, ax = subplots(figsize=(8, 8))

for i, (color, t2) in enumerate(zip(colors, theta2)):
    y, x = divmod(i, 2)
    wedge = Wedge(
        (x, y), r=r, theta1=0, theta2=t2,
        width=0.25, color=color, label=f'category{i+1}'
    )
    ax.add_artist(wedge)

    # Wedge Artists do NOT automatically update data limits
    #   use this in combination with `Axes.autoscale_view`
    #   so that we don't need to manually set x/y limits
    ax.update_datalim([
        (x + r, y + r), (x - r, y - r),
        (x - r, y + r), (x + r, y - r),
    ])


legend = ax.legend(
    title='Default Handler', loc='upper left',
    bbox_to_anchor=(1.01, 1),
)
# Preserve original legend on plot, or else next call to
#    ax.legend will replace the previous one
ax.add_artist(legend)

ax.legend(
    title='Custom Handler', loc='upper left',
    bbox_to_anchor=(1.01, 0.5), handler_map={Wedge: WedgeHandler()},
    labelspacing=1
)
ax.set_title('Custom Legend Handles', size='large')
ax.autoscale_view()
ax.tick_params(
    which='both', labelbottom=False, labelleft=False,
    bottom=False, left=False
)
ax.invert_yaxis()

show()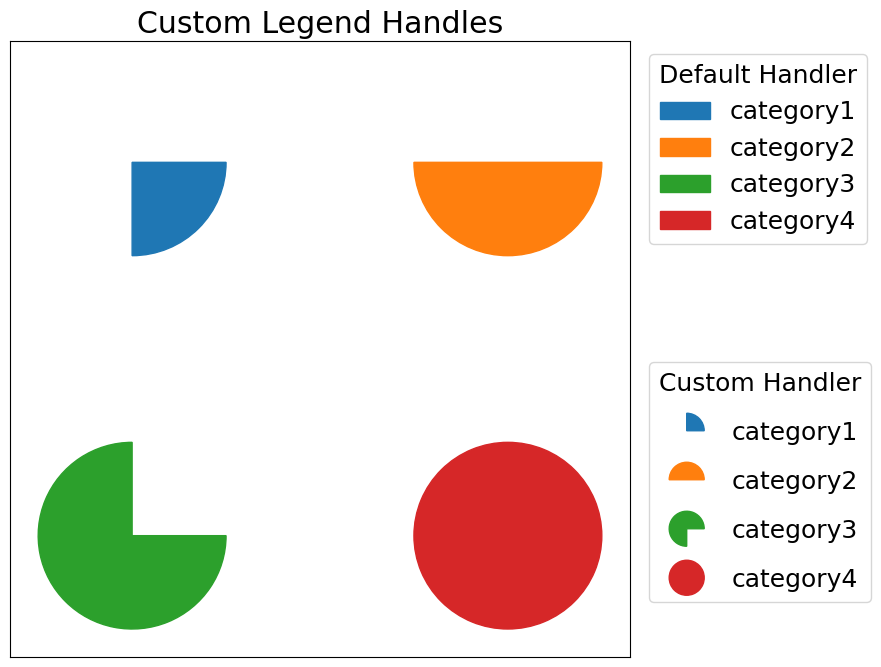
Wrap Up
And there you have it! A brief tutorial on how to take even more control over your matplotlib plots. I hope you enjoyed this article and use it to make it pretty in matplotlib. Talk to you all next week!