President Rankings - a pandas challenge
Welcome back to another edition of Cameron’s Corner! We have some exciting events coming up, including a NEW seminar series and a code review workshop series. In our brand new seminar series, we will share with you some of the hardest problems we have had to solve in pandas and NumPy (and, in our bonus session, hard problems that we have had to solve in Matplotlib!). Then, next month starting October 12th, we will be holding our first ever “No Tears Code Review,” where we’ll take attendees througha a code review that will actually help them gain insight into their code and cause meaningful improvements to their approach.
I recently received a question about webscraping and pandas and wanted to share with you an example I had come across. As with most code I run into online, I thought to myself, "What I would change if I wrote this from scratch."
The goal was to scrape and recreate the table of presidential attribute rankings in Python.
Simple Webscraping with Requests & BeautifulSoup
Examining the web page, the first thing I noticed was that the table uses abbreviations for its x labels. Things like "Bg" and "Im" are meant to be abbreviated forms of attributes.
Thankfully, a key of abbreviations and their corresponding unabbreviated form is right above the table. I wanted my final plot to have the unabbreviated form of the labels and had to think of away to use these mappings in my code. The way I see it, I had two choices:
Hard code the abbreviation mappings.
Dynamically generate the abbreviation mappings.
While hard coding may cause loud and early failures (which is a good thing), it is also entirely resistant to page updates (e.g., if the source updates with a new abbreviation and corresponding column in the table). As such, I opted for the latter approach to dynamically create the abbreviation mappings. I mean, I’m already scraping the entire page, why not do a little more fun parsing?
from requests import get

resp = get('https://en.wikipedia.org/wiki/Historical_rankings_of_presidents_of_the_United_States')

resp.raise_for_status()
I like separating my requests work from my parsing work to rapidly iterate on my parsing code without needing to re-fetch the HTML data. In Jupyter Notebooks, you can separate this logic to essentially cache the http response.
When parsing for specific entities, it is always useful to anchor onto something directly tied to that feature. Unfortunately, neither the table nor the abbreviations have an id or unique structuring that enables us to jump immediately to them. However, moving up the page, there is a <span> embedded within an <h3> tag that has an id. So, I first start by jumping to that span and moving to its containing parent—this gets us in a good position to parse the next couple of tags to retrieve both the abbreviations and the table!
from bs4 import BeautifulSoup

soup = BeautifulSoup(resp.content)

# The h3 element containing the span that has an id tag we can anchor onto
poll_section_header = (
    soup.find('h3', id='2018_Siena_College')
    .parent
)

descriptions = (
    poll_section_header
    .find_next('dt', text='Abbreviations')
    .find_next_siblings(lambda tag: (tag.name == 'dd') & (tag.string is not None))
)

abbreviations = dict(dd.text.split(' = ') for dd in descriptions)

abbreviations
{'Bg': 'Background',
'Im': 'Imagination',
'Int': 'Integrity',
'IQ': 'Intelligence',
'L': 'Luck',
'WR': 'Willing to take risks',
'AC': 'Ability to compromise',
'EAb': 'Executive ability',
'LA': 'Leadership ability',
'CAb': 'Communication ability',
'OA': 'Overall ability',
'PL': 'Party leadership',
'RC': 'Relations with Congress',
'CAp': 'Court appointments',
'HE': 'Handling of economy',
'EAp': 'Executive appointments',
'DA': 'Domestic accomplishments',
'FPA': 'Foreign policy accomplishments',
'AM': 'Avoiding crucial mistakes',
'EV': "Experts' view",
'O': 'Overall'}Data Loading & Cleaning in pandas
Now that we have the abbreviations dealt with, we can start parsing a DataFrame from the <table> tag. Thankfully, pandas.read_html makes this quite easy for us! This function returns a list of DataFrames from every parsed <table> on a given page. In order to have pandas only parse the table of interest (as there are many tables on this page), we can pass a string representing only <table> instead of passing the entire http response.
abbreviations{'Bg': 'Background',
'Im': 'Imagination',
'Int': 'Integrity',
'IQ': 'Intelligence',
'L': 'Luck',
'WR': 'Willing to take risks',
'AC': 'Ability to compromise',
'EAb': 'Executive ability',
'LA': 'Leadership ability',
'CAb': 'Communication ability',
'OA': 'Overall ability',
'PL': 'Party leadership',
'RC': 'Relations with Congress',
'CAp': 'Court appointments',
'HE': 'Handling of economy',
'EAp': 'Executive appointments',
'DA': 'Domestic accomplishments',
'FPA': 'Foreign policy accomplishments',
'AM': 'Avoiding crucial mistakes',
'EV': "Experts' view",
'O': 'Overall'}from io import StringIO
from pandas import read_html
# Using my BeautifulSoup from before, we just need to find the
# correct table to ensure pandas will only parse
# the table that we are interested in
table = poll_section_header.find_next('div').find_next('table')
df = (
read_html(StringIO(table.decode()))[0]
.set_index('President')
.dropna(how='all') # Filter bad rows
.replace(regex=r'\(.*\)', value='') # Remove parenthesized values
.astype(
dict.fromkeys(abbreviations, 'int8')
| {'Seq.': str, 'Political party': 'category'}
)
)
df.head()| Seq. | Political party | Bg | Im | Int | IQ | L | WR | AC | EAb | ... | PL | RC | CAp | HE | EAp | DA | FPA | AM | EV | O | |
|---|---|---|---|---|---|---|---|---|---|---|---|---|---|---|---|---|---|---|---|---|---|
| President | |||||||||||||||||||||
| George Washington | 1 | Independent | 7 | 7 | 1 | 10 | 1 | 6 | 2 | 2 | ... | 18 | 1 | 1 | 1 | 1 | 2 | 2 | 1 | 2 | 1 |
| John Adams | 2 | Federalist | 3 | 14 | 4 | 4 | 24 | 14 | 32 | 21 | ... | 28 | 17 | 4 | 13 | 15 | 19 | 13 | 16 | 10 | 14 |
| Thomas Jefferson | 3 | Democratic-Republican | 2 | 2 | 14 | 1 | 8 | 5 | 14 | 6 | ... | 5 | 5 | 7 | 20 | 4 | 6 | 9 | 7 | 5 | 5 |
| James Madison | 4 | Democratic-Republican | 4 | 6 | 7 | 3 | 16 | 15 | 6 | 13 | ... | 9 | 10 | 6 | 14 | 7 | 11 | 19 | 11 | 8 | 7 |
| James Monroe | 5 | Democratic-Republican | 9 | 15 | 11 | 18 | 6 | 16 | 7 | 10 | ... | 12 | 8 | 11 | 9 | 9 | 10 | 5 | 6 | 9 | 8 |
5 rows × 23 columns
The data cleaning is fairly straightforward:
set our index
drop empty rows and redundant column(s)
tidy up the string data
cast appropriate types to our columns
rename the abbreviations → full names using our abbreviations dictionary
Of these, I think the most interesting is the final step enumerated here. I don’t actually think its a necessary data transformation step—and should instead be a visualization transformation. The primary reason for this is that if I ever need to do work with my DataFrame (specific column cleaning, column insertion/removal), then having to type out those incredibly long column names may become tedious. In that sense, I’m going to delay my transformation of the abbreviations on my DataFrame and instead transform them on my visualization.
Data Visualization in matplotlib and seaborn
seaborn is great for simplifying statistical plotting operations. It is built on top of matplotlib, so it’s never a necessity, but it sure is convenient. Being able to generate a heat map with luminance-based text annotations (e.g., white text on dark backgrounds and dark text on light backgrounds) is tricky as I don’t know of many people who can convert RGB → luminance values off the top of their head without needing Google.
With that being said, creating this visualization is quite straightforward. seaborn takes care of setting our appropriate ticks and tick_labels on both of our Axis objects, and it even creates a colorbar for us as well! Just a few final steps to tidy up the visualization.
from matplotlib.pyplot import rc, subplots, show
from numpy import roll, arange
from seaborn import heatmap

rc('font', size=16)
rc('figure', facecolor='white')
rc('axes', titlesize=20, labelsize=18, titlepad=18)
rc('xtick', labelsize=16)
rc('ytick', labelsize=16)

fig, ax = subplots(figsize=(12, 14), dpi=90)

heatmap(
    df.select_dtypes('int8').sort_values('O').loc[:, lambda d: roll(d.columns, 1)],
    annot=False, cmap='viridis_r', ax=ax,
    cbar=True, cbar_kws={'label': 'Ranking\n(lower value → better rank)'}
)

ax.set_title('Presidential Rankings (Sienna College Survey 2018)', fontsize='x-large')

ax.set_yticks(
    arange(len(df.index)) + .5,
    [f'{t} {i: >3}' for i, t in enumerate(df.select_dtypes('int8').sort_values('O').index, 1)]
)
ax.set_xticklabels(
    [abbreviations[t.get_text()] for t in ax.get_xticklabels()],
    rotation=45,
    ha='right',
    rotation_mode='anchor'
)

fig.tight_layout()
fig.canvas.draw()
bbox = ax.xaxis.get_tightbbox()
fig.text(
    s='Data: https://en.wikipedia.org/wiki/Historical_rankings_of_presidents_of_the_United_States#2018_Siena_College',
    x=bbox.x1,
    y=bbox.y0,
    ha='right',
    va='top',
    transform=None,
    size='x-small',
    color='gray',
    alpha=.8,
)

cbar_ax = fig.findobj(match=lambda artist: artist.get_label() == '<colorbar>')[0]
cbar_ax.invert_yaxis()

show()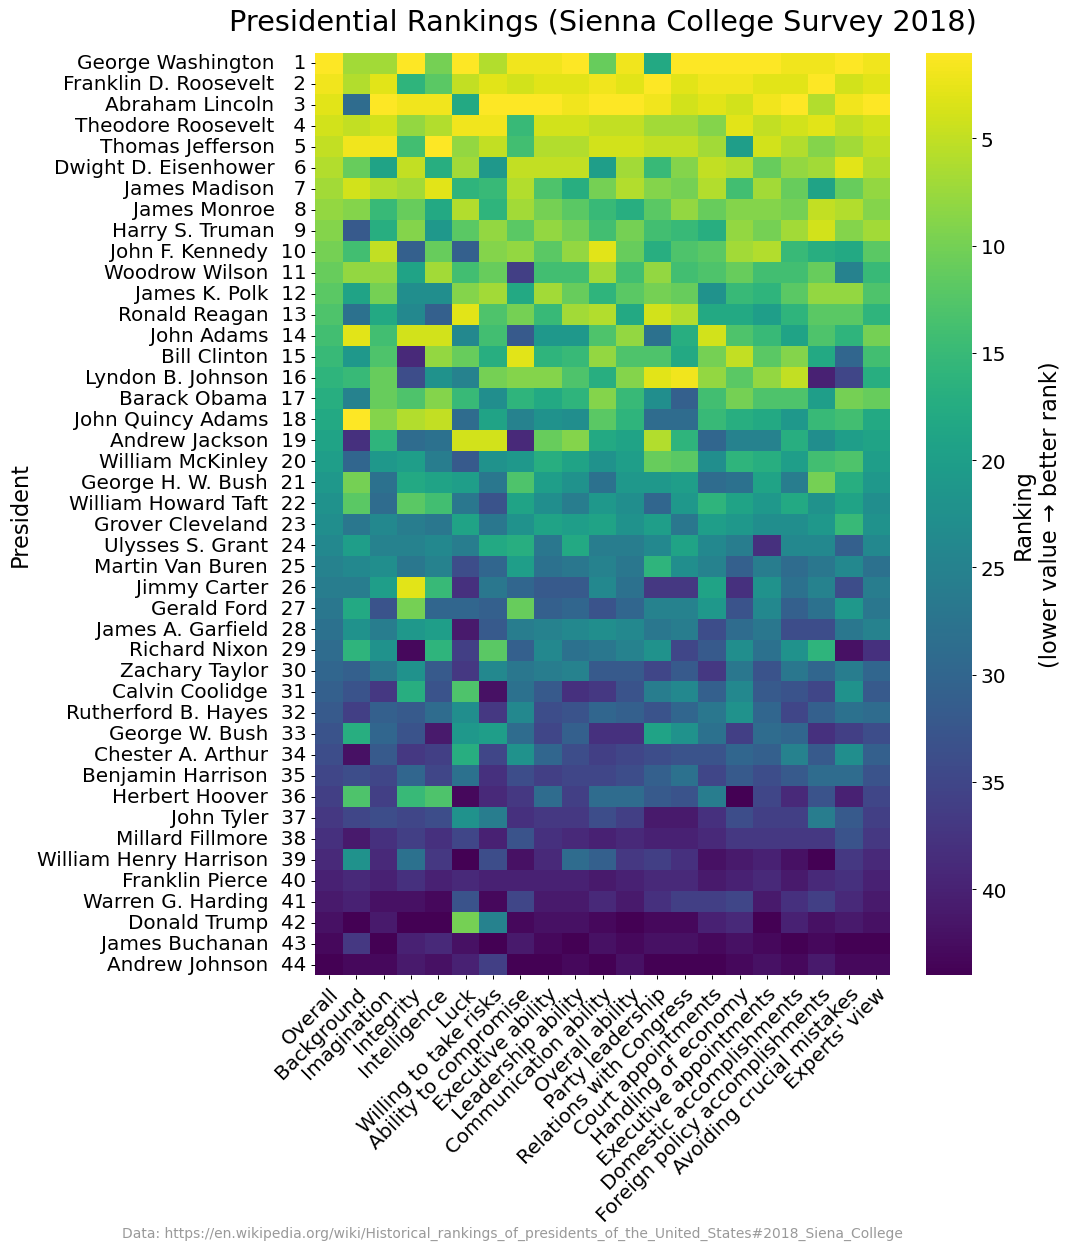
I’ll need to set my title and transform my x & y tick labels. The x tick labels need to map to their unabbreviated counter parts; we can use a dictionary look up while looking through the current x tick labels set with seaborn.
I also flipped my colorbar so that the numbers appeared in descending order instead of ascending. If you're not familiar, you can use findobj to select specific Artists on a given Figure. In this case, I wanted to select the divided Axes that the colorbar was drawn on to invert it and provide a better sense that lower ranks are a better value.
Wrap Up
And that's it for this week! Thanks for tuning in everyone, talk to you all next time.